The Evolution of Observability – From Monitoring to Intelligence
By: Nathan Owen

This is Part 1 of a four-part series where I’ll dive into the evolving Observability landscape. I’m going to explore the existing Observability landscape, emerging trends where I think startups can win, and key insights for founders building companies in the space.
The Series at a Glance
📌 Part I (this blog) – The Evolution of Observability: From Monitoring to Intelligence
📌 Part II – The Observability Landscape: Who’s Winning, Who’s Losing, and What’s Next?
📌 Part III – The Future of Observability: Where Startups Can Win
📌 Part IV – The Founder Playbook: Building a High-Growth Observability Startup
A Bit about My Background in Observability
Before joining Grand Ventures in 2021, I spent over a decade as a founder in the Observability space, primarily focused on building Observability integrations and an integration hub — all while nurturing deep technical partnernships with wide range of Observability vendors including Google, VMware, New Relic, AppDynamics, Oracle, SumoLogic, Grafana, IBM, and others.
At Grand Ventures, I lead our investments in DevOps and Developer Tools, with a strong emphasis on Observability. A significant amount of my time is spent tracking Observability trends, engaging with early-stage Observability startups, and identifying where the next wave of innovation is happening.
I sit on boards and/or have led Grand’s investments in a number of companies across emerging sub-segments within the Observability space including Traceloop, (Observability for AI), Tembo (AI Observability for Databases), and BindPlane (Observability Pipelines).
Part I (This blog) – The Evolution of Observability: From IT Monitoring to Intelligence
A Brief History of Observability
For the purposes of this blog, it’s important to recognize that the term “Observability” as it relates to monitoring IT, is a relatively recent development. From the 1980s until nearly 2020, this domain was more commonly referred to as “IT Monitoring” or simply “Monitoring” and was often grouped under broader categories like “IT Systems Management (ITSM)” or “Systems Management.”
The term “observability” in the context of IT and software systems was popularized by Charity Majors, co-founder of Honeycomb.io. She and her team championed the idea that traditional IT monitoring—focusing on predefined metrics and dashboards—was insufficient for modern distributed systems.
Majors and others in the DevOps and SRE (Site Reliability Engineering) communities adapted the concept from control systems theory, where Rudolf E. Kálmán first introduced observability in the 1960s. In control theory, a system is considered observable if its internal state can be inferred from its outputs.
The definition of Observability is: “Observability lets you understand a system from the outside by letting you ask questions about that system without knowing its inner workings. Furthermore, it allows you to easily troubleshoot and handle novel problems, that is, “unknown unknowns”. It also helps you answer the question “Why is this happening?”1
Majors and the Google team team drew a clear distinction between Observability and traditional Monitoring:
- Monitoring relies on predefined dashboards, metrics, and thresholds to detect known issues.
- Observability, in contrast, enables engineers to explore unknown failures by analyzing raw data, logs, traces, and signals—making it far more effective for troubleshooting complex, modern architectures.
While Majors was instrumental in bringing observability into mainstream IT discussions, other industry figures—like Google’s SRE team (which published the Google SRE book)—also helped shape its modern meaning in software engineering.
Majors drew a clear distinction between Observability and traditional Monitoring, arguing that Observability required a fundamentally different approach. I could write a whole other long-form blog post on Charity and other’s arguments on why Observability was distinct, but for now, I’ll skip ahead. Despite Charity’s efforts to differentiate the term “Observability” and draw a line for everything that came before, the term Observability has gradually, and perhaps inevitably, become the industry’s default label for the entire space—including legacy monitoring tools. This pattern is not unique; similar rebranding/name evolution has occurred in other technology sectors, such as “Backup” evolving into “Data Protection.”
Recently, there has been some momentum in calling the pre-modern observability (“IT Monitoring” era (ie prior to 2016 or so) as Observability 1.0, and everything post the appearance in the late 2010’s of companies like Honeycomb, Lightstep, and others as the epoch of the Observability 2.02 era. That distinction make a lot of sense to me.
Observability (IT Monitoring) 1960-2020
Before I explore what the Observability space looks like today and where it’s headed, it’s useful to look and it’s past:
The Dawn of Monitoring (1960s – 1980s)
In the early days of computing, monitoring was rudimentary, primarily focused on ensuring uptime and tracking basic resource usage. These were the mainframe years, where system administrators relied on physical monitoring via light panels on consoles themselves to simple logs and threshold-based alerting to keep systems running.
![IBM System/360 control panel at the Living Computer Museum in Seattle, WA [OC] [1600×1066] : r/MachinePorn](https://substackcdn.com/image/fetch/f_auto,q_auto:good,fl_progressive:steep/https%3A%2F%2Fsubstack-post-media.s3.amazonaws.com%2Fpublic%2Fimages%2Fe09b5bbf-ad42-45c0-83a6-33d778722fd8_1600x1066.jpeg "IBM System/360 control panel at the Living Computer Museum in Seattle, WA [OC] [1600×1066] : r/MachinePorn")
Technologies like System Management Facilities (SMF) records on IBM mainframes and early Simple Network Management Protocol (SNMP) implementations began shaping the way system data was collected. Logs were often just text files, requiring manual interpretation. Vendors like IBM dominated this space, offering tools that were largely reactive—alerting administrators only after an issue occurred.
Monitoring was largely console-based, with administrators poring over green-on-black terminal outputs displaying CPU usage, memory consumption, and disk activity. While primitive by today’s standards, these tools were essential for early system operations, laying the foundation for what was to come.
The Rise of System Management (1990 – Mid 2000s)
As client-server architectures gained traction, the need for more sophisticated monitoring grew. The 1990s saw the rise of system management platforms that provided centralized control over increasingly complex infrastructures.
HP (OpenView), IBM (Tivoli Monitoring), BMC (Patrol), and CA Unicenter , collectively known at the time as the “Big 4” along with Microsoft Operations Manager (MOM, later SCOM), were the dominant players, introducing graphical user interfaces (GUIs) to replace the old text-based consoles. SNMP became more widely adopted, enabling broader network and server monitoring. Additionally, the first Application Performance Monitoring (APM) tools began emerging, helping organizations gain visibility into software performance.

Monitoring moved from reactive to proactive approaches, attempting to correlate events and identify potential problems before they impacted users.
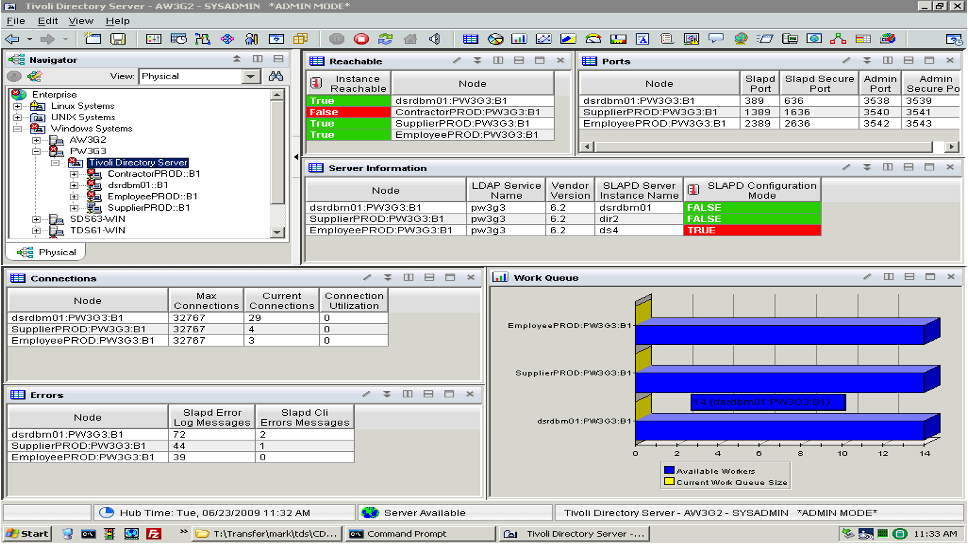
The tools of this era were often complex, expensive, and focused on infrastructure, with limited application-level visibility.
The Dawn of APM (Mid 2000s – ~2018)
With the explosion of web applications and e-commerce, monitoring priorities shifted from infrastructure to application performance. This era saw the emergence of early APM vendor such as Precise, Wiley, and Mercury and then later full APM suites from vendors like Dynatrace, AppDynamics, and New Relic, which provided deep visibility into application behavior.
New capabilities like transaction tracing allowed engineers to track requests across different components, while synthetic monitoring simulated user interactions to measure performance. Technologies like Java Virtual Machine (JVM) monitoring and .NET CLR monitoring became essential for understanding application health.
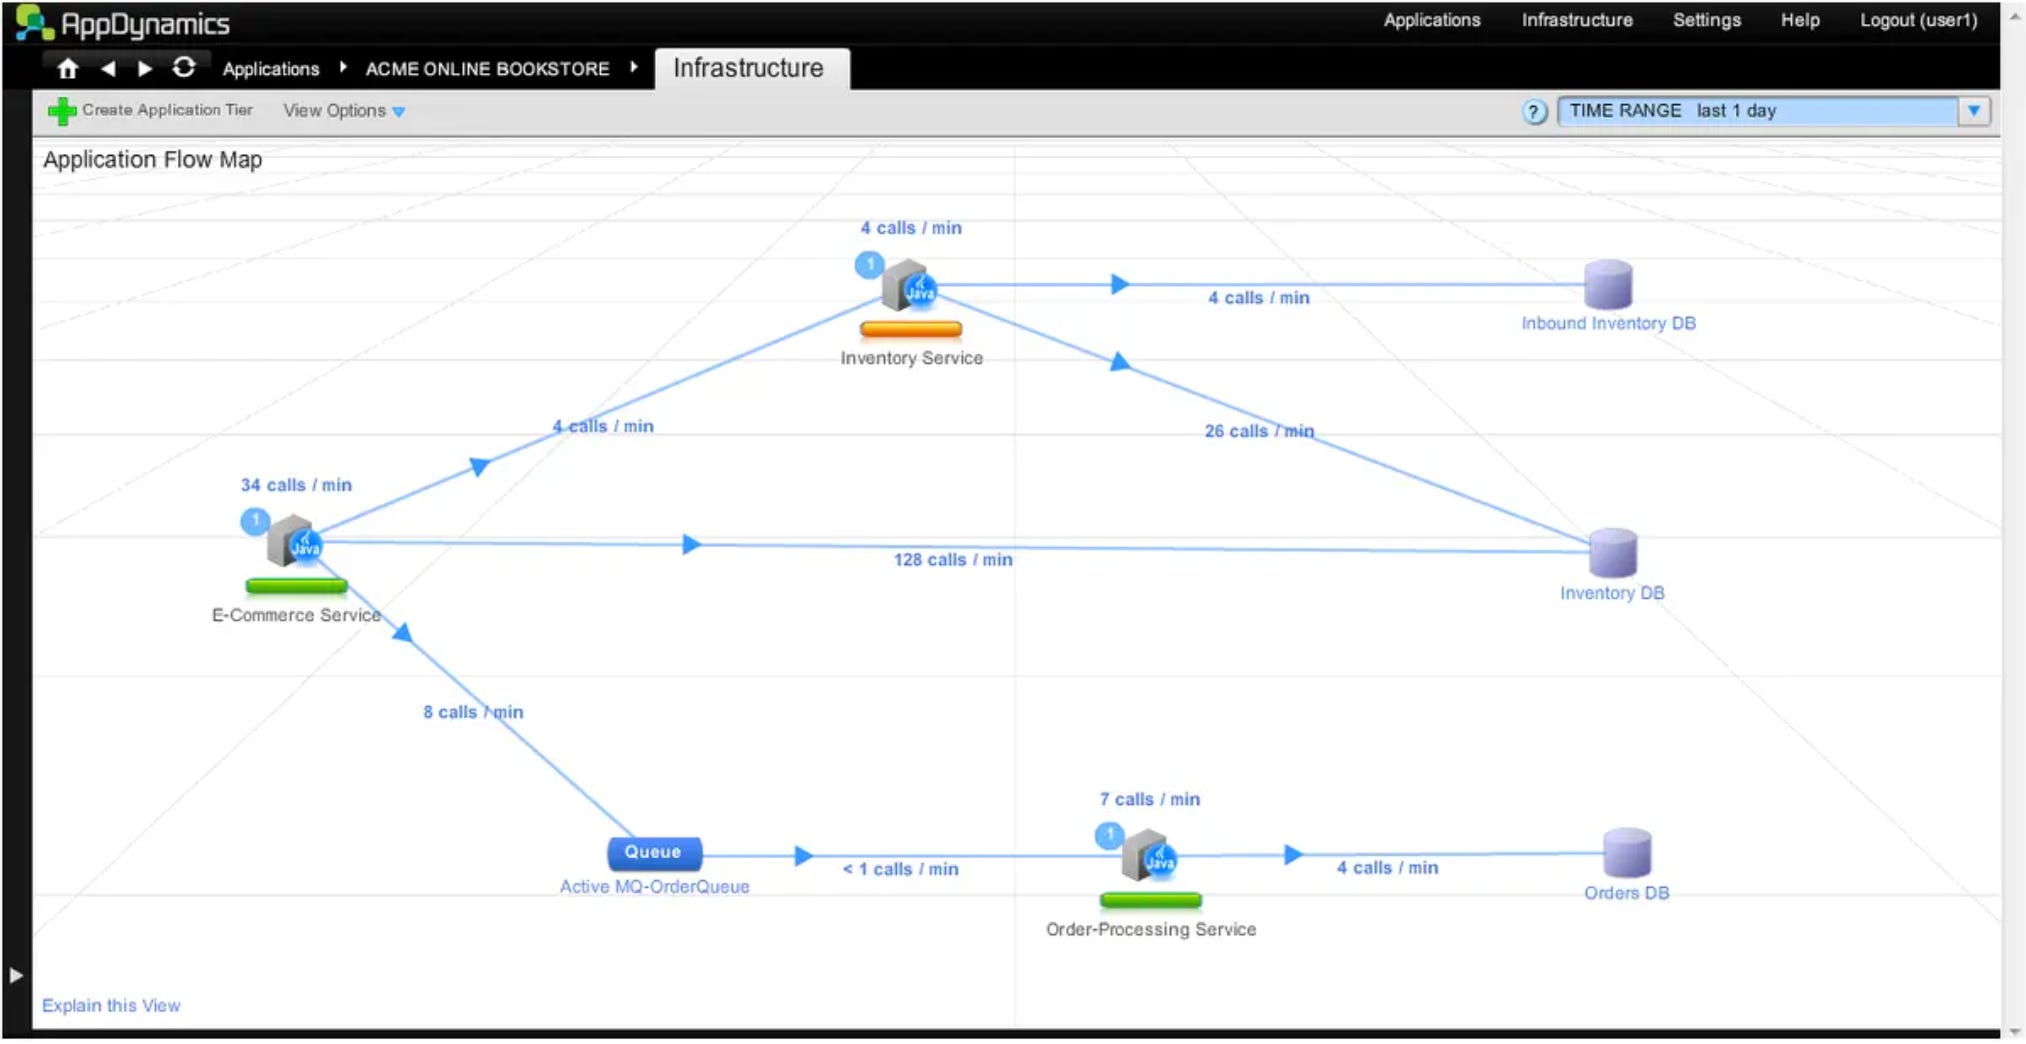
This was a pivotal shift: instead of just monitoring servers, businesses were able, for the first time, to tie performance metrics to user experience and business outcomes. While this first generation of APM tools provided invaluable insights, they were typically expensive and complex to configure, making them accessible mainly to large enterprises managing mission-critical applications.’
It was in the early 2000s that dedicated log monitoring solutions, like Splunk (2003), first appeared. The early iterations of these products where cross-overs from the Security Information and Event Management (SIEM) space. By the end the decade, competitors, such as SumoLogic, began to appear.

Open Source monitoring solutions also began to proliferate during this era. There are far too many to do justice to, however, some of the more popular ones were Nagios, and Zabbix.

The Rise of Cloud and DevOps (2010s – Early 2020s)
The adoption of cloud computing and DevOps practices fundamentally transformed the monitoring landscape. Traditional infrastructure monitoring struggled to keep up with highly dynamic, distributed, and ephemeral cloud environments.
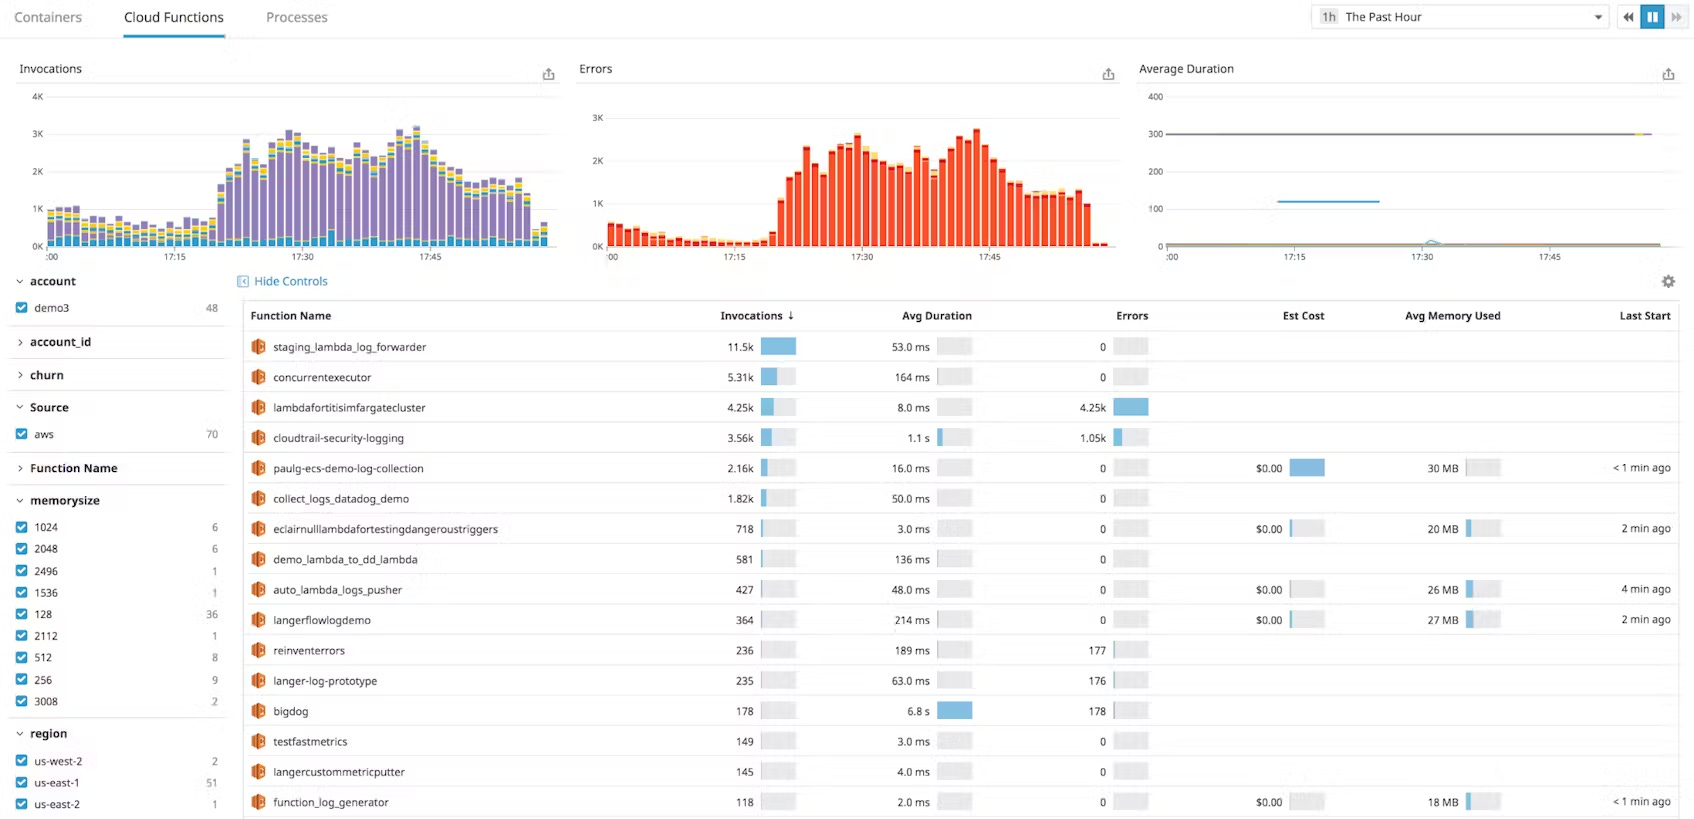
This era saw the rise of cloud-native monitoring solutions such as AWS CloudWatch, Azure Monitor, and Google Cloud Monitoring, along with a surge in open-source tools like Prometheus, Grafana, and the ELK stack (Elasticsearch, Logstash, Kibana).
Key trends included:
- Developer Centric Monitoring platforms, from vendors such as Datadog, Signalfx (acquired by Splunk), Wavefront (acquired by VMware), and Instana (acquired by IBM), on the leading edge of modern, Developer-centric (as opposed to Ops Centric) approaches to Monitoring. When these solutions first appeared on the scene, they were often categorized as Infrastructure Monitoring solutions.
- Monitoring as Code, where monitoring configurations were automated using tools like Terraform.
- Open Source tracing and logging tools like Jaeger, Zipkin, OpenCensus, Open Tracing, FluentD, and AWS X-Ray, essential for microservices monitoring.
- AIOps, leveraging AI and machine learning to automate anomaly detection and incident response.
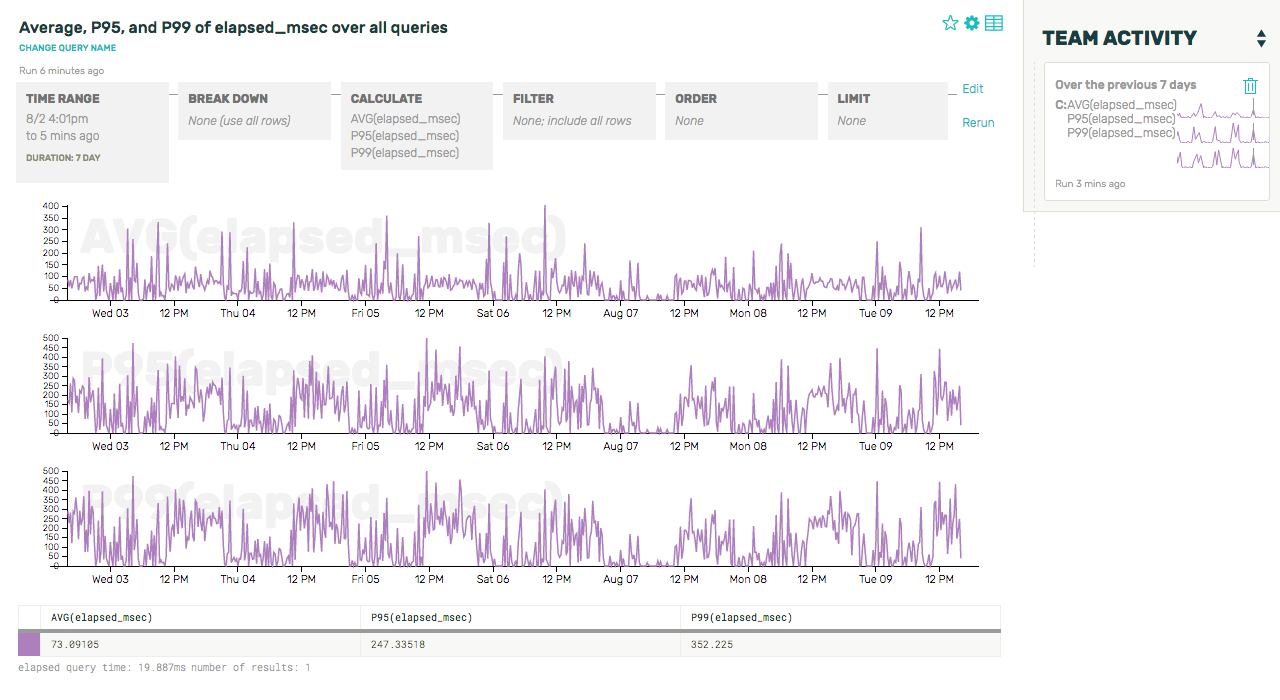
- First wave of “Observability 2.0” vendors including Honeycomb, Lightstep, and others.
With cloud environments generating massive volumes of telemetry data, monitoring tools needed to scale efficiently. The focus shifted toward automation, cost optimization, and extracting meaningful insights from a sea of data.
The Observability 2.0 Era (~2020 – Present)
Part 3 of this blog series is going to deep-dive into the current Observability era. The TLDR is since ~2020 we’ve been seeing the industry shift from simply detecting problems to understanding why they happen. Context is now king, and the trend is towards provide actionable insights rather than just raw data.
Key technologies driving this transformation include:
- OpenTelemetry (OTel), now the standard for collecting telemetry data.
- eBPF (Extended Berkeley Packet Filter), enabling low-overhead observability at the operating systemkernel level. Cilium, is an example.
- Observability for AI, focused Observability for AI core technologies, including AI Agents, LLMs, Vector DBs, and other AI stack elements. Technologies like OpenLLMetry and vendors like Traceloop, Fiddler, and Arize play in this space.

- AI-powered observability, using machine learning to predict failures and automate root cause analysis.
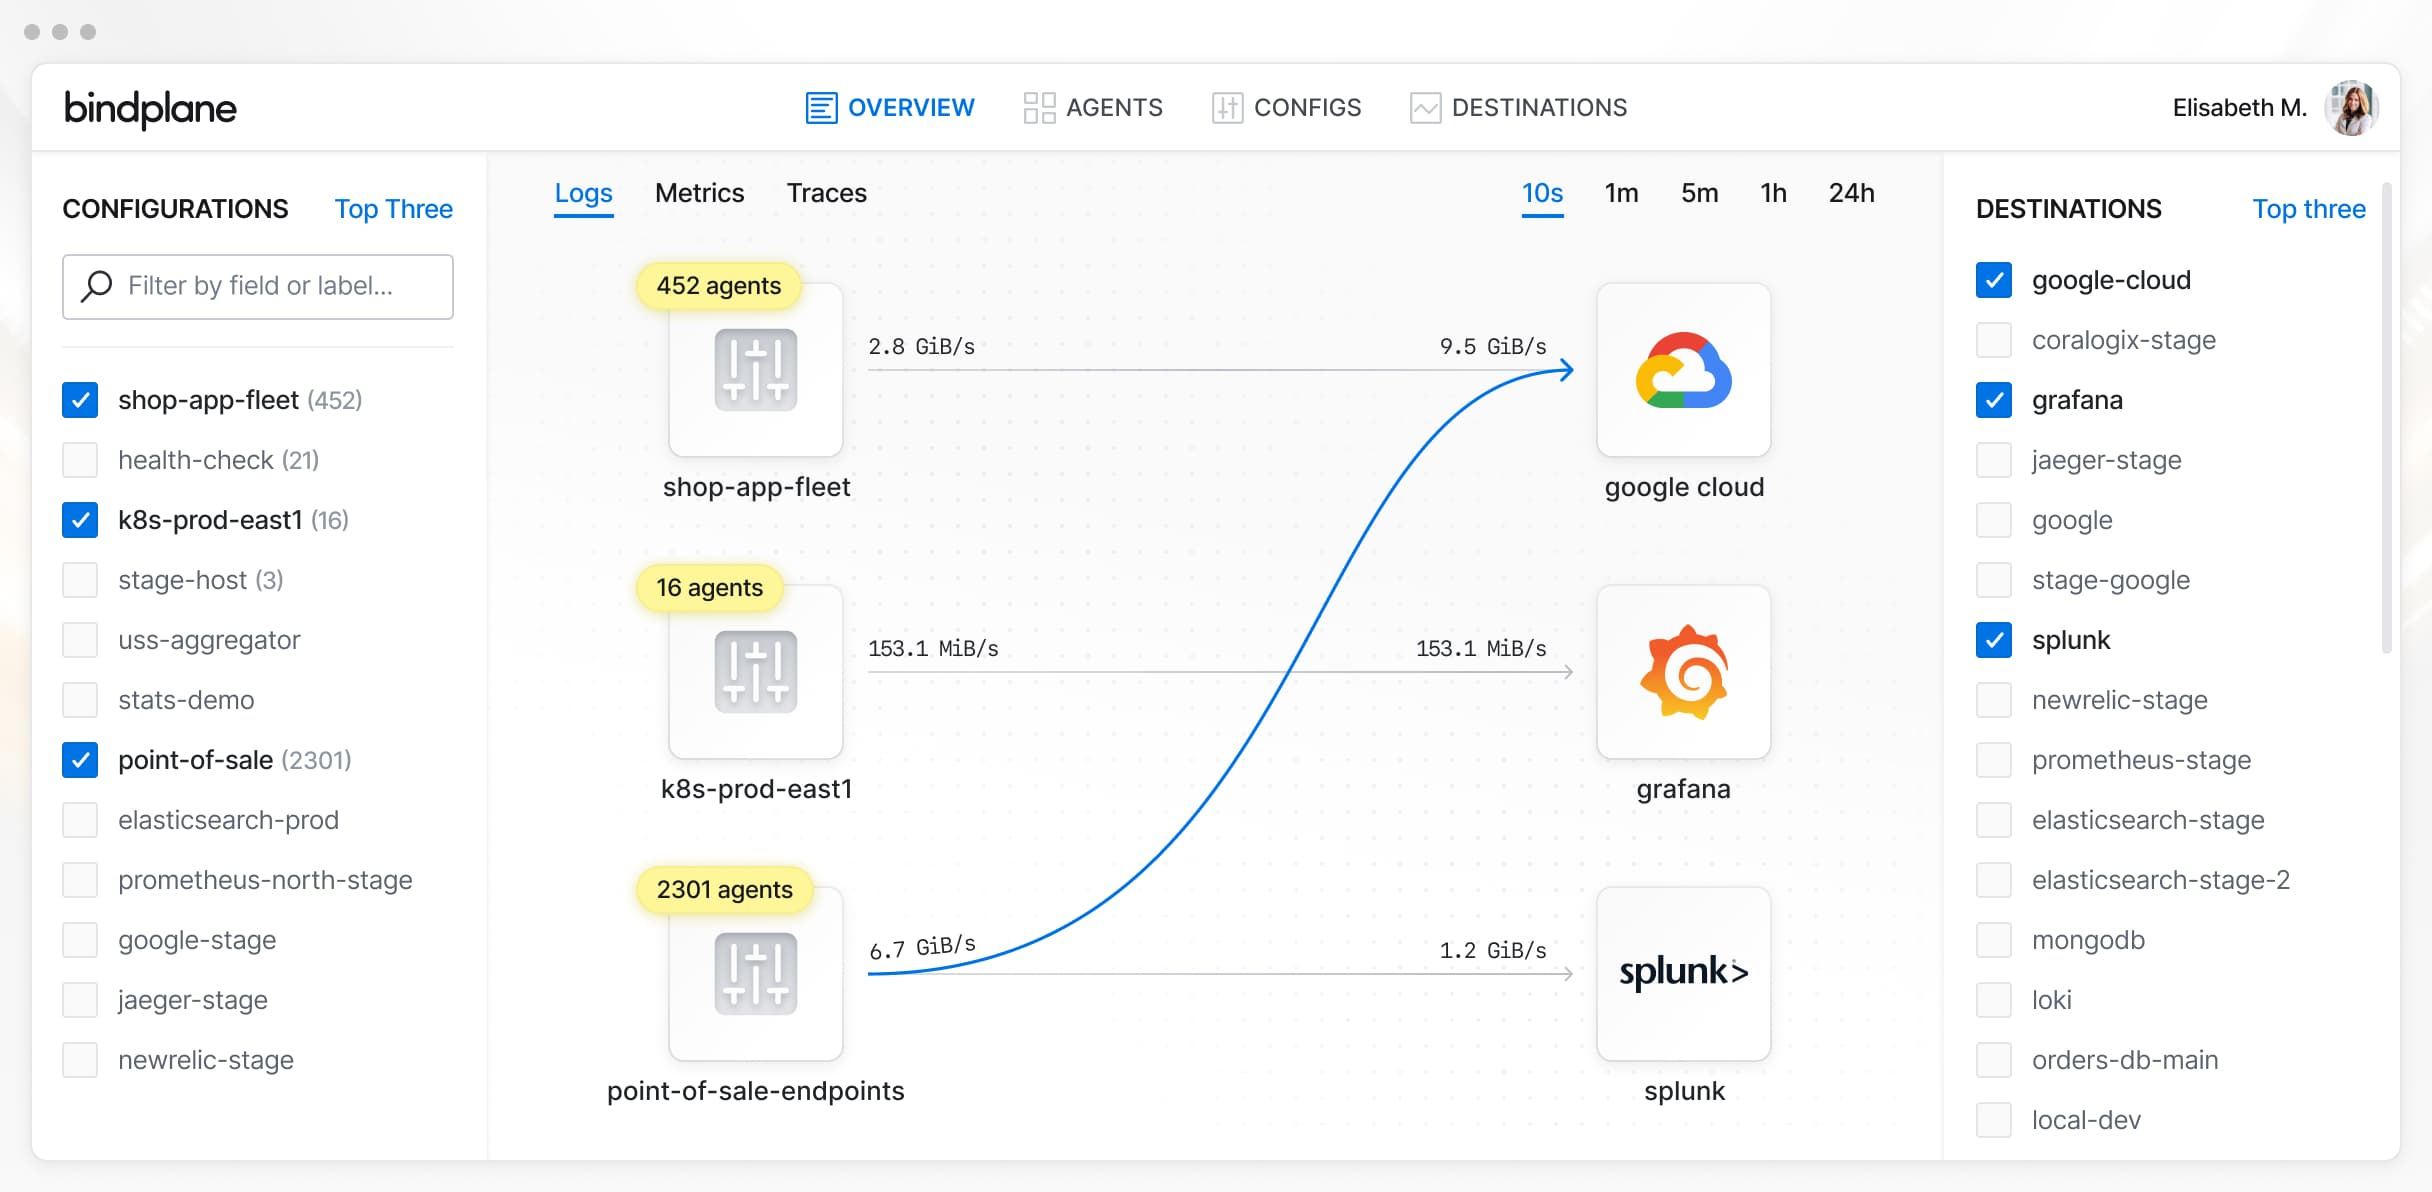
- Observability pipelines like BindPlane, Cribl, and Vector, designed to route, enrich, and consolidate / deduplicate telemetry data.
In this most recent era, organizations are embracing developer-led observability, where their monitoring/observability tools are integrated directly into development workflows. Observability is no longer just an operational concern; it’s becomes a core engineering practice.
What’s Next?
Observability has come a long way from its IT Monitoring roots, but in ways we are only today starting to see the actual payoff from the decades of R&D and investment within the Observability pay off.
In Part II (the next blog in this series), I’ll deep-dive into the current Observability landscape including:
- What are the sub-sectors with in the Observability space?
- Who are the biggest players in each of those sub-sectors as well as at the “suite” level?
- Where are startups successfully disrupting incumbents?
- What trends are define the next generation of Observability solutions?
Stay tuned. 🚀
If you’re working on a game-changing new observability platform or have come up with a novel approach to this space, We’d love to hear from you! Feel free to me a line at nathan@grandvcp.com.
_____________________________________________________________________________________
1: Observability Primer, CNCF OpenTelemetry Docs
2: It’s Time to Version Observability: Introducing Observability 2.0, Honeycomb.io Blog, September 2024